Gain Your Edge with Unrivaled Insider Trading Intelligence
Transform raw SEC Edgar data into actionable insights. See what company insiders are really doing, before the market catches on.
Start by searching a company name or ticker symbol above to unlock detailed visualizations.
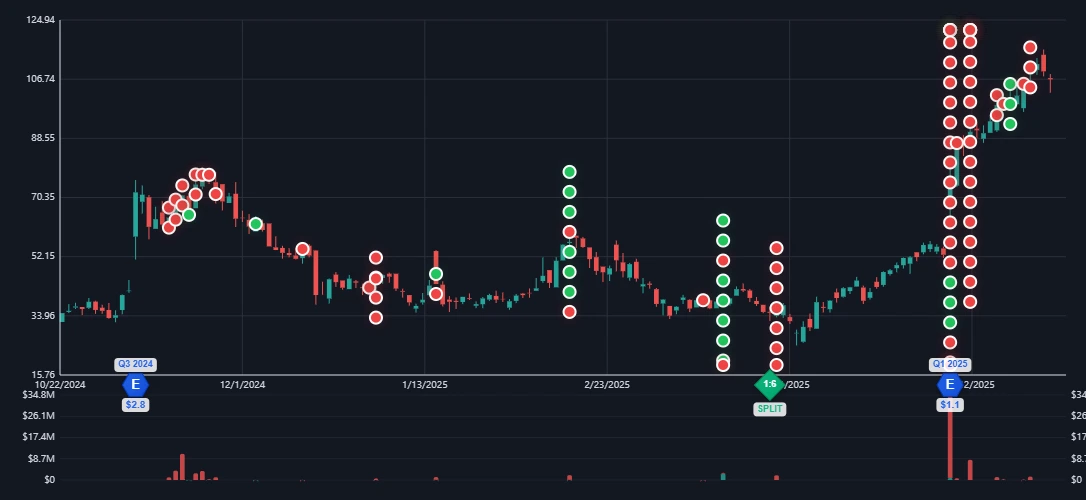
Visualize Every Move: Stock Prices & Insider Trades
Our interactive stock charts map out price history alongside every buy and sell transaction by company insiders, complete with volume data. Instantly spot trends and significant activities sourced directly from SEC filings.
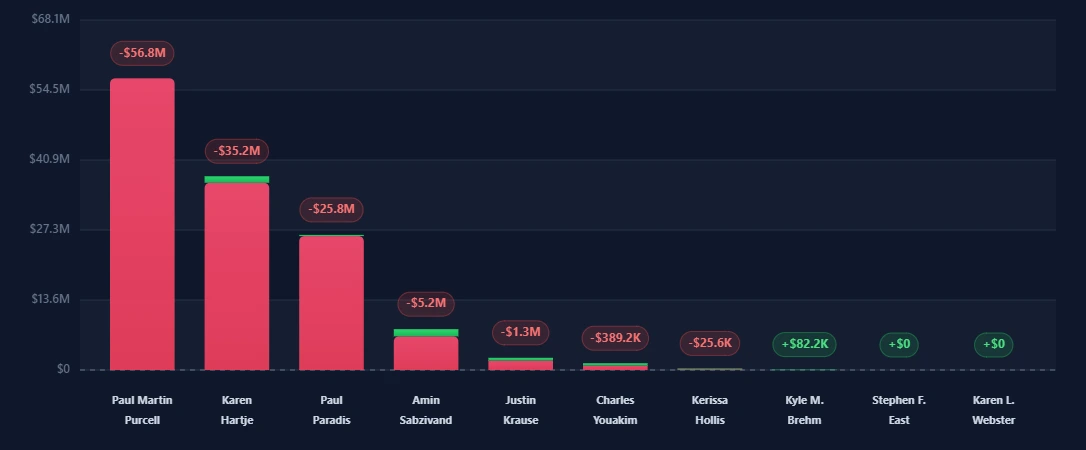
Who's Moving Markets? Transaction Volume by Insider
Go beyond simple trades. Our transaction volume bar charts clearly identify the largest buyers and sellers within a company, revealing who holds the most conviction and potential influence derived from SEC data.
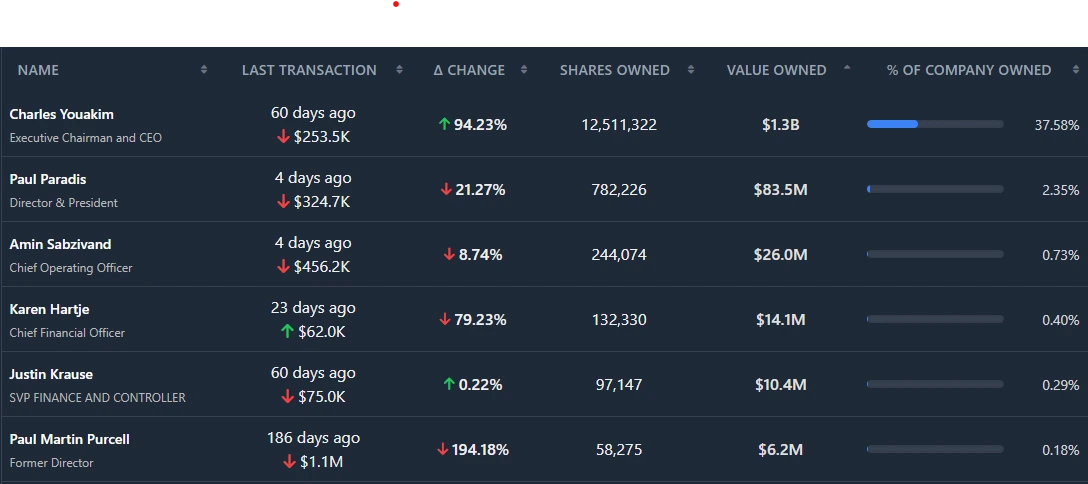
Know the Key Players: Insider Share Ownership
Track the largest shareholders and monitor how their positions evolve over your chosen timeframe. Understand ownership concentration and significant changes in holdings with our detailed breakdown, all from SEC filings.
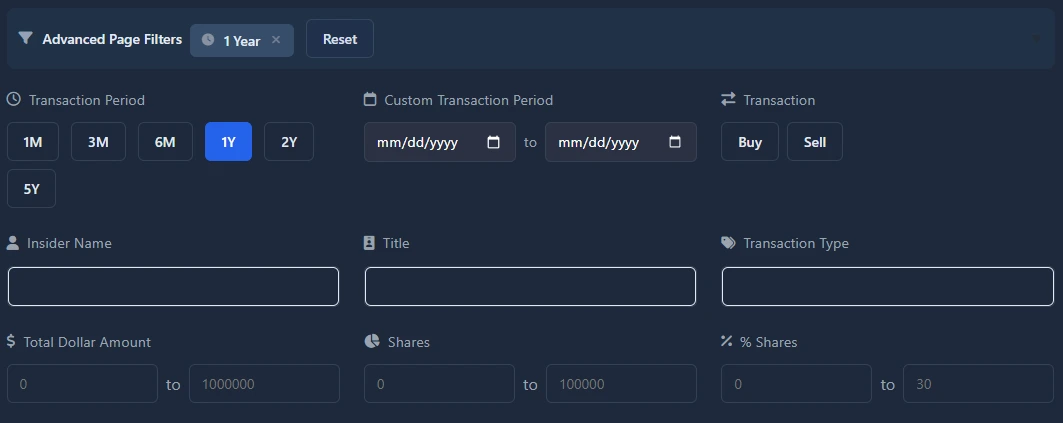
Data on Your Terms: Pinpoint with Advanced Filters
Navigate the sea of insider trading data with ease. Our powerful and intuitive filters let you zero in on specific transaction types, insiders, date ranges, dollar amounts, and more, giving you exactly the information you need from SEC reports.
Authentic Data, Superior Experience
At Insidr.Finance, we're committed to providing the most accurate and timely insider trading information, sourced directly from official SEC Edgar filings. Our platform is designed for an unparalleled user experience, empowering you to make informed decisions. Discover the transparency and power of raw financial data, beautifully visualized to give you an edge in analyzing stock trends and shareholder activity.